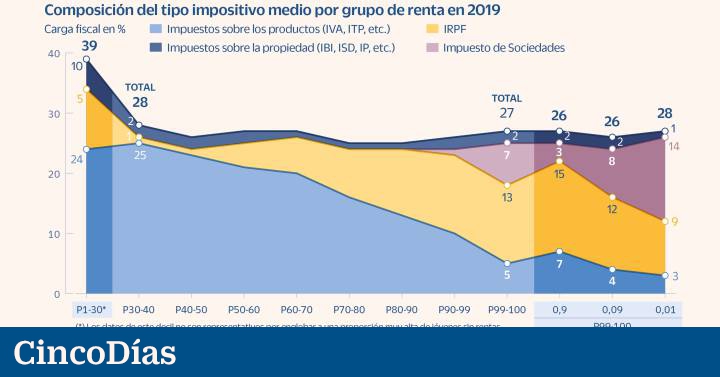
The tax pressure borne by the lowest incomes in Spain is practically similar to that affecting the richest in the country. In proportion to their assets and adding the main figures of the Spanish tax system, the lowest income deciles are subject to an average rate of 28%, while the highest decile in the table bears a somewhat lower rate, around 27%. .
In turn, if the most privileged 1% of the population is broken down into three parts, 0.9% and 0.09% pay a rate of 26%, while the remaining 0.01% pay another 28%. . The figures, in short, are practically similar. “These data show us how the Spanish tax system, as a whole, has been losing progressivity over the years”, as explained by Clara Martínez-Toledano, researcher at EsadeEcPol and responsible for the report. Income Inequality and Redistribution in Spainpublished this week by the thinktank from business school.
First of all, it should be remembered that the analysis of the document starts from the third income decile, since the first two groups can distort the general picture by including the elderly who still do not have real estate or work income. “If taxes are assigned to these deciles, made up largely of young people in their 20s who have not yet started working or who have no assets, erroneous conclusions are drawn,” explains Martínez-Toledano.
Once this point has been clarified, the document analyzes the evolution of the tax burden in Spain over two decades, from 1999 to 2019. In 2003, for example, the average rate paid by the third decile (the lowest low for this analysis) stood at 28%, somewhat below what the richest paid. Four years later, in 2007, the most common rate for low incomes was 26%, while the richest 1% was subject to one of 40%, 14 percentage points more. However, in 2019, the last year with available data, the tax burden is practically homogeneous throughout the entire income distribution.
This loss of progressivity is explained, continues Martínez-Toledano, by the evolution of the main tax figures and the changes in their designs since then.
personal income tax
Analyzing the weight on the different income deciles, the personal income tax (IRPF) is the only figure that manages to maintain its progressive character. The population that falls into the lowest decile of the analysis pays an average rate of 1%, which increases as income increases up to the 13% paid by the last decile. The richest 0.9%, on the other hand, are subject to a 15% rate, 0.09% to a 12% rate, and 0.01% to a 9% rate. For all these reasons, in the general x-ray that draws the tax “it can be seen how the weight of the tax is increasing at the same rate as income,” the researcher details.
Societies
The EsadeEcPol report distributes all national income and taxes among households. Although corporation tax falls on companies, “companies belong to someone,” adds the expert. “We do not have specific tax data, but we do have the dividends collected in the IRPF. What we do is assign corporate income tax to those dividends.”
With this methodology, it is possible to extract the weight that Companies have in each income group, and the conclusion is clear. From the 10th income decile to the 80th, the rate applied is 0%. The tax burden begins to grow from the 90th decile up to a maximum rate of 14% for the wealthiest 0.01% of the population.
Another possible reading of this dance of figures, recalls Martínez-Toledano, is that if the weight of Companies in the total tax burden were deducted, the rate of the highest incomes would be around half of that applied to groups lower income.
VAT
Taxes on consumption and other products, mainly VAT, also serve to show the lack of progressivity of the system based on income. In 2019, for example, the population with the lowest incomes was subject to a tax rate of around 25%, while in the upper part of the table the burden was significantly below 10%. The richest 0.01%, in particular, applied a rate of only 3%. “Although taxpayers with higher incomes tend to consume more, and also more expensive products, in the end the entire population has to consume. For this reason, and always in proportion to income, it is seen how groups with lower incomes suffer a much higher average tax rate”.
Property
The tax burden borne by real estate property income, says Martínez-Toledano, seems to be the most homogeneous of the entire income distribution, ranging between 1% and 2% in all the groups analysed. This, however, has two nuances. On one side is the real estate tax (IBI), which proportionally affects all the groups analyzed by the weight that home ownership has in Spain. On the other, however, is the effect of the tax credits enjoyed by high net worth individuals. It does not seem reasonable, he adds, that the highest incomes (0.01%) bear only a rate of 1%. “This is explained by the exemptions and deductions to which these incomes can benefit, as well as by the tax competition between autonomous communities, which encourages the movement of large assets between some regions and others.”
Inequality
The report highlights that the 1% of the population that earns the most in Spain accumulated 17% of the national income in 2019, a gap that has grown four points since the outbreak of the financial crisis in 2008, since the participation of the richest in national wealth a year earlier was 13%. For the wealthiest 1%, income from work represented less than 35% of their income, while the weight for the rest of the population ranged between 65% and 85%. In contrast, the richest obtained more income from capital than the groups with lower incomes.
#lowest #incomes #bear #tax #burden #similar #richest